How to Use DroughtView
Layouts
Single Map
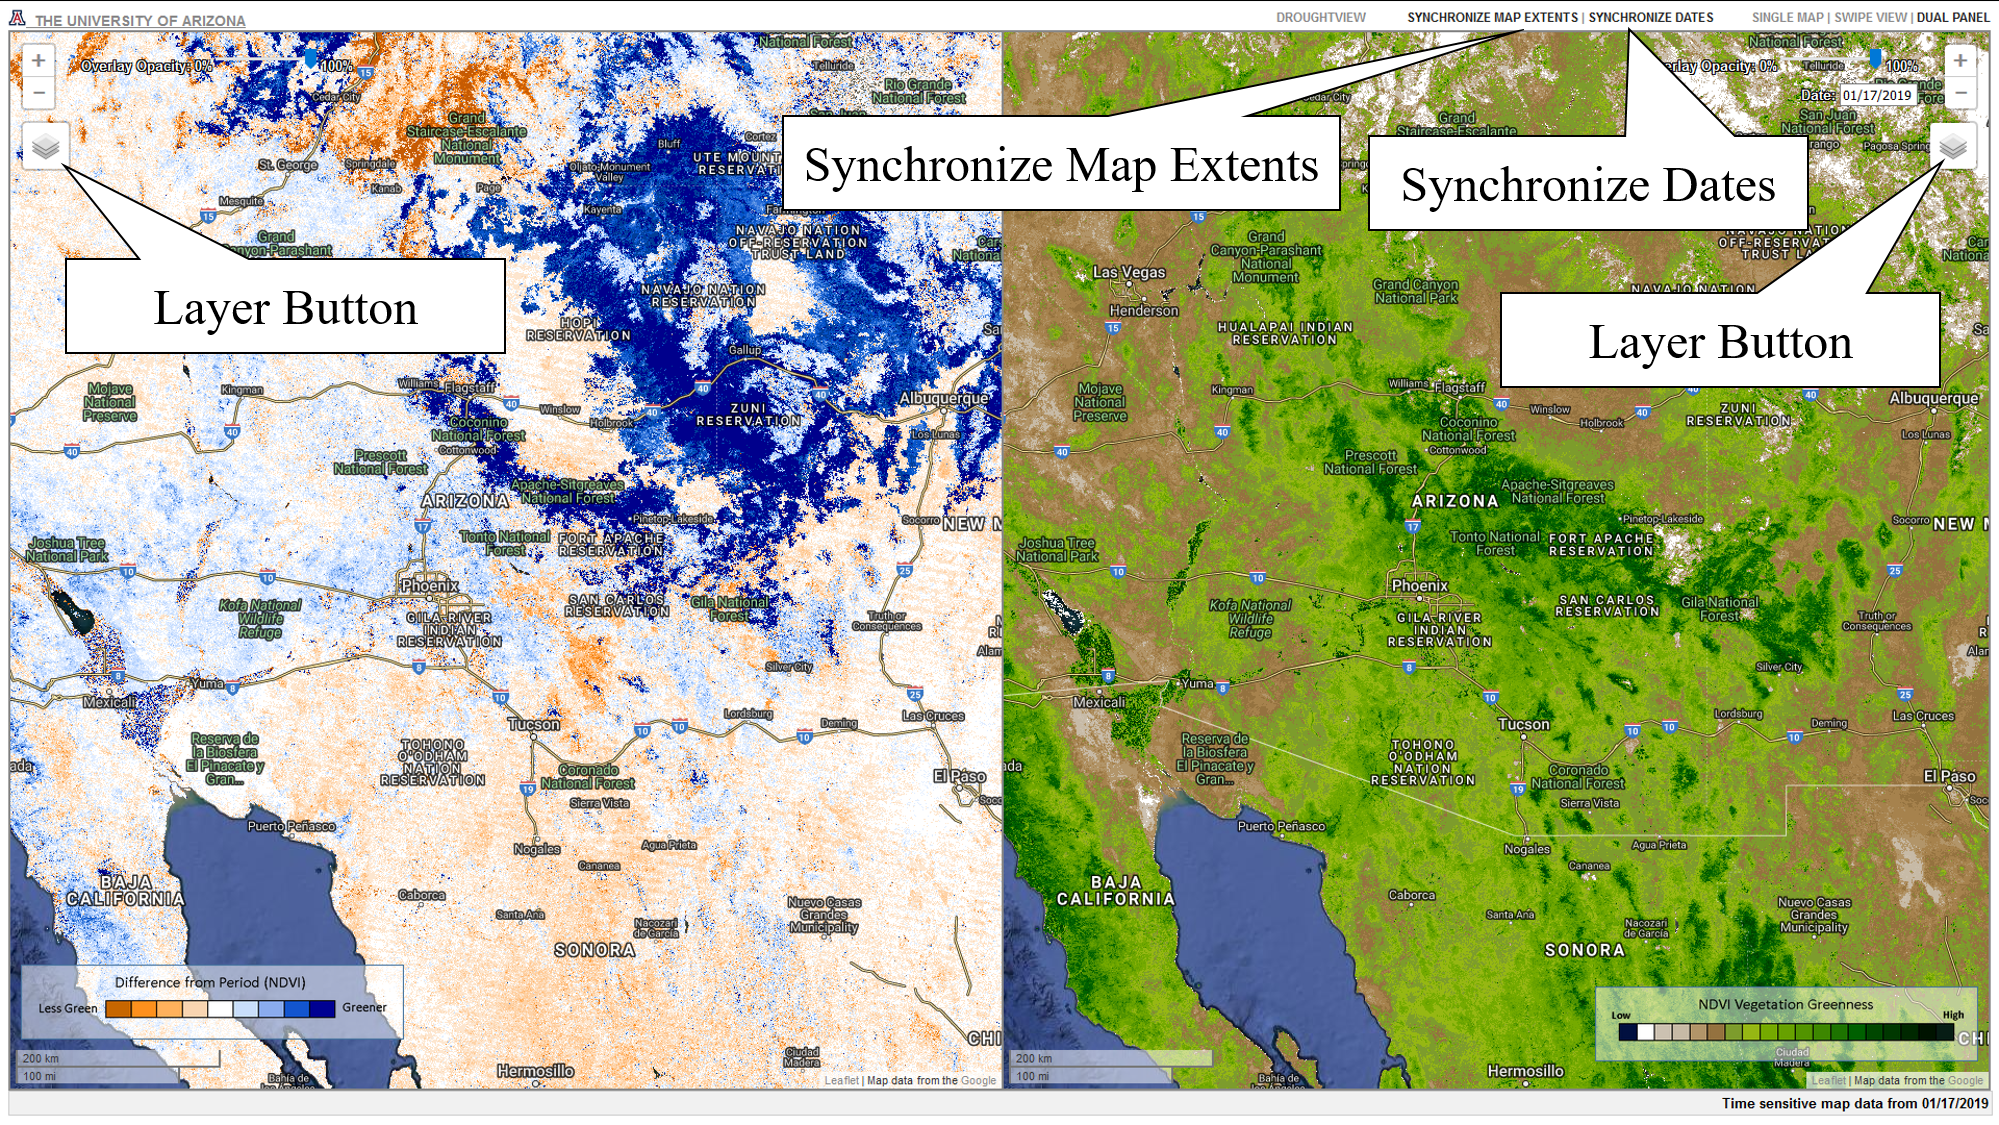
When DroughtView initially loads, the default Single Map view displays. You can display one product layer for one date using this layout.
Swipe View
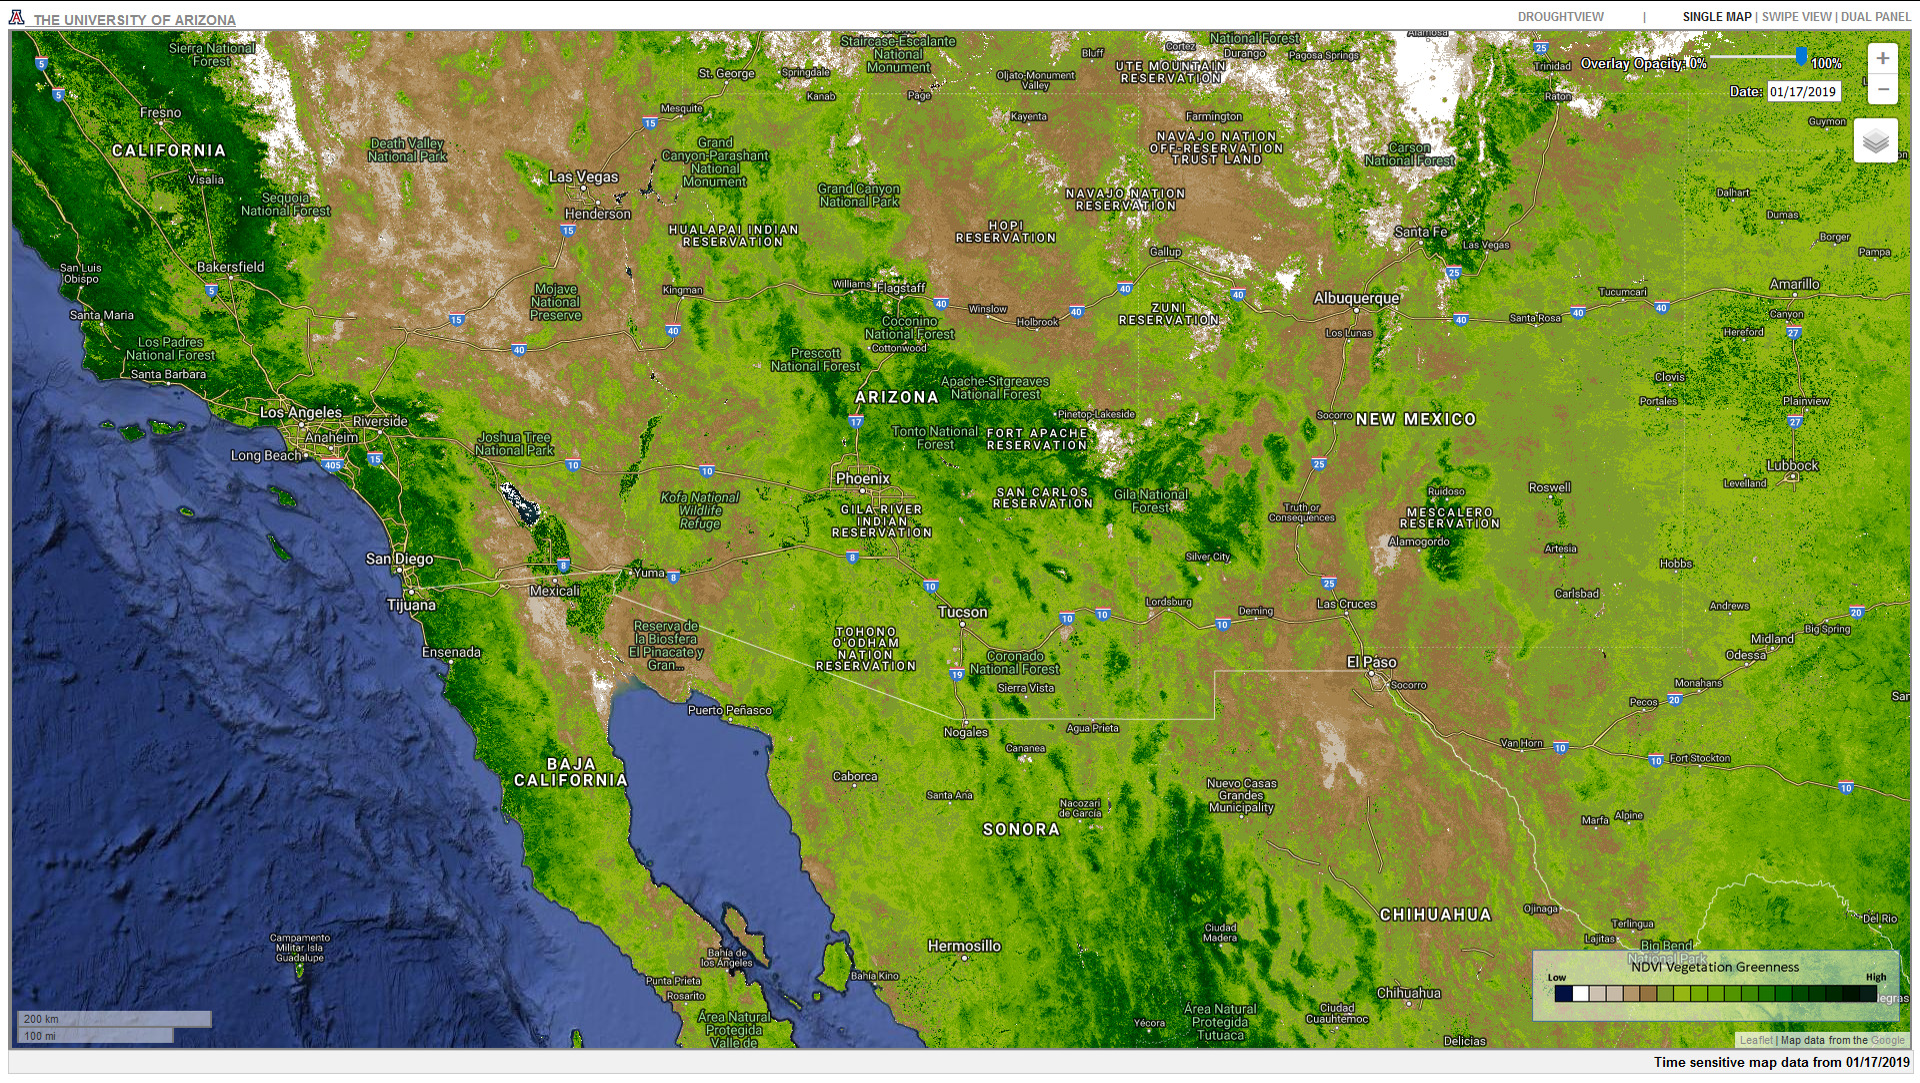
You can access a swipe tool by clicking the Swipe View option. You can swipe back and forth between two product layers using the Swipe Tool. You can load different products into each panel by using the Layer Button located in that panel. You can also desynchronize the two panels by clicking the Synchronize Dates button in order to display different dates of products in the two panels. You can resynchronize the panels by clicking the Synchronize Dates button again.
Dual Panel
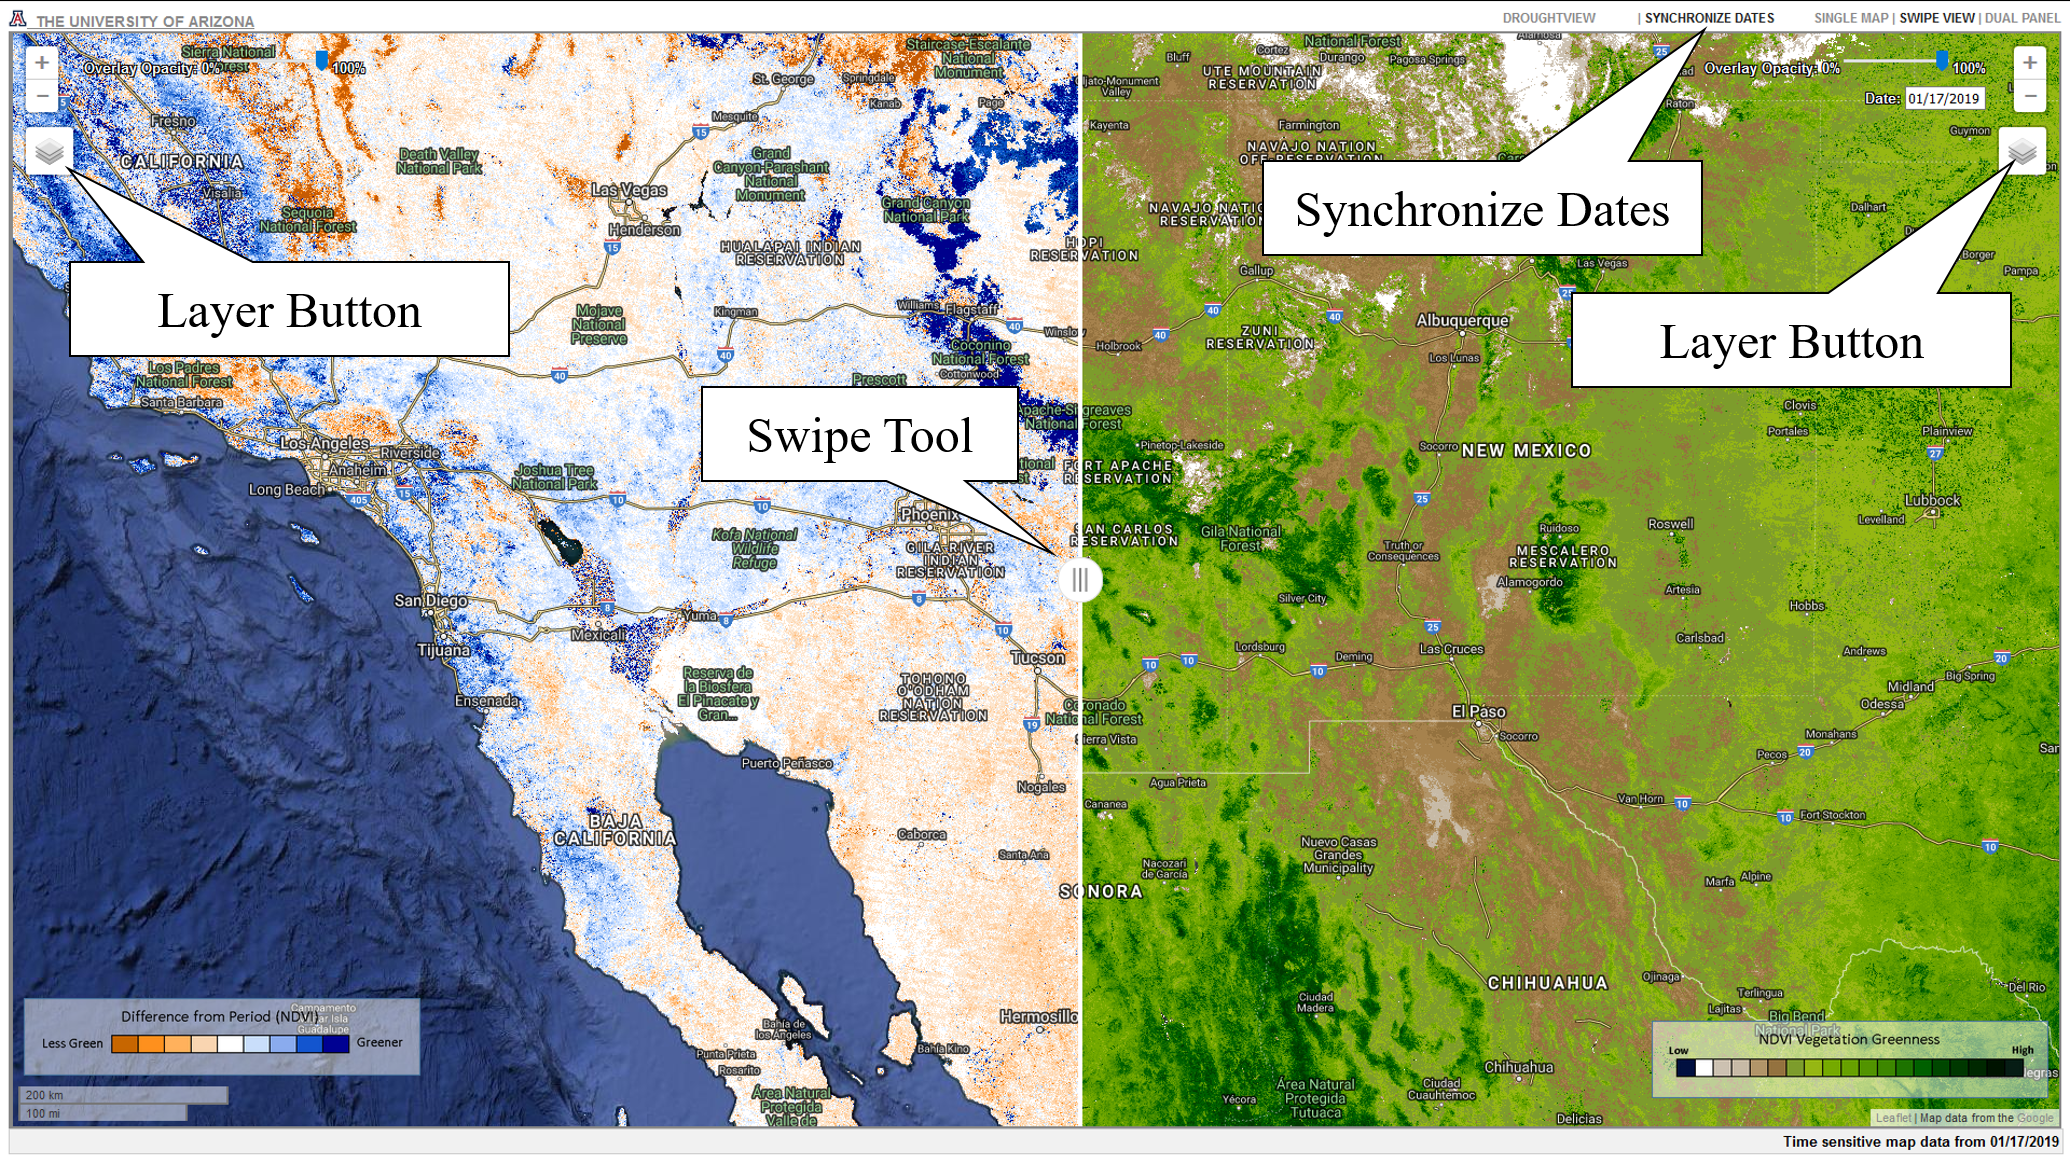
You can access a dual panel layout by clicking the Dual Panel option. You can load different products into each panel by using the Layer Button located in that panel. You can also desynchronize the two panels by clicking the Synchronize Dates button in order to display different dates of products in the two panels. You can resynchronize the panels by clicking the Synchronize Dates button again. Moving one panel will move the other panel to the same location. Unless you click the Synchronize Map Extents button, in which case you can adjust each panel independently. You can resynchronize the map extents by clicking the Synchronize Map Extents button again.
Navigation
Zoom You can zoom in and out of a panel by using that panel's Zoom Button. You can also zoom in and out on a panel using the scroll wheel on your mouse.

Opacity You can change the opacity of a product layer by using the Opacity Bar located in each panel. Pulling the marker on the Opacity Bar to the left increases the transparency of the product layer, while pushing it right increases the opacity of the product layer.

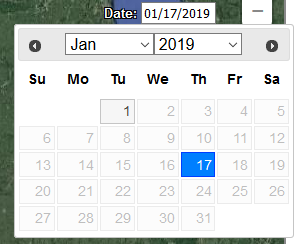
Date You can select the date of a product by clicking the Date Tool in a panel. A calendar box will appear allowing you to change the month, year, and day.
Legend The legend related to the product currently present in a panel appears at the bottom of that panel. The title of the legend tells you which product is currently loaded in that panel.


Scale Bar The scale bars in the lower left-hand corner of each panel will adjust based on the current zoom level.

Layers Click the Layer Button to access the various levels of the layer menu. Note that maps under the MODIS GEENNESS, VIIRS GREENNESS, and CLIMATE Tabs are time-enabled, meaning that they will change when a new date is selected on the calendar picker. Other maps, such as those under BASEMAPS and PLACES AND BOUNDARIES will not.

BASEMAPS
Basemaps appear under all other layers. They will appear if you move the marker on the Opacity Bar all the way to the left. Click the bubble next to the basemap you would like to display in the panel.
MODIS GEENNESS, VIIRS GREENNESS, and CLIMATE Tabs
These time-enabled raster products are specifically designed for DroughtView. This includes vegetation greenness layers from MODIS and VIIRS, precipitation composite layers, Drought Monitor overlays and cloud/snow masks for MODIS and VIIRS. Click the bubble next to the raster overlay under the appropriate heading that you would like to display in the panel. Note that the vegetation data are two-week composites (to remove clouds from the vegetation images). The date displayed is roughly in the middle of each composite and the text at the bottom of the map shows the valid dates for the vegetation data. The climate data are valid for the date chosen on the date picker.
PLACES AND BOUNDARIES AND FIRE DATA TABS
The PLACES AND BOUNDARIES tab includes Federal Lands, Grazing Allotments, Watershed Boundaries, and Roads and Borders, while the FIRE DATA tab includes data for large fires, fire detections, fire boundaries, and burn severity maps. Check the squares next to the layers to display the Vector Data in your panels. You can display multiple vector files at the same time. This data appears above all other layers.
Drawing Tools
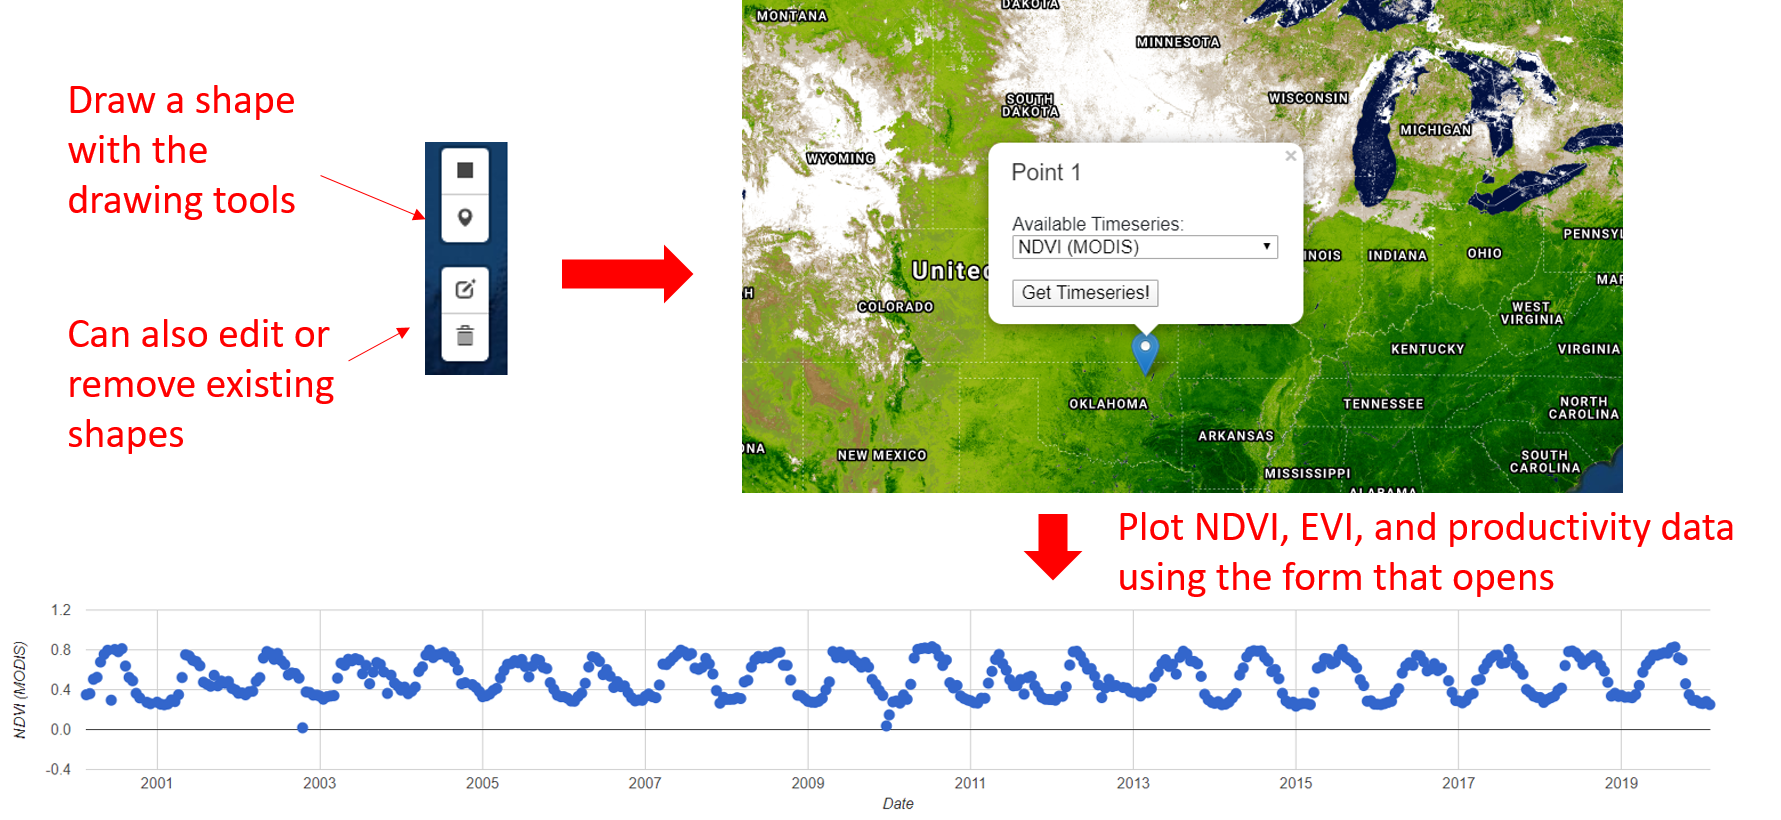
These tools allow the user to draw a rectangle or a point. Then, these drawn features have a bubble giving the user an option to display time series of NDVI and EVI data from MODIS and VIIRS as well as Annual Productivity data. Select the desired time series, and click "Get Timeseries!' This will open a tab at the bottom of the screen that has an interactive chart. Click and drag on a region on the chart to zoom into that period. Right click to zoom out. You can also download the time series that is displayed on the chart using the link at the bottom of the screen.
When opening a chart, be patient as there are a lot of maps to extract data from. Note that the chart will not display anything in an area where there is no data (this is especially important to keep in mind for the productivity data). If a point is selected, the data will be for a particular map pixel, and if an area is selected, it will be an average of the area (excluding no data areas)
